

“Details hold beauty, but only the whole image conveys the message.” This idea mirrors the journey every great project begins: a single data-driven decision-making choice. That first step, deciding whether to start, is what sets the path.
When you face a decision, be it launching a business strategy or reviewing a project, you naturally want to inform yourself. In the past, gathering data was a painstaking process that could stretch across months or even years.
Today, with the world swimming in information, the real challenge isn’t finding data; it’s conducting efficient data analysis and transforming it into insight.
What Is Data Analytics?
At its core, data analytics is the process of sifting through large volumes of information, discarding corrupted or irrelevant parts, structuring the data coherently, and molding it into a model (whether that's a dashboard, report, or visualization) that delivers insight to a target audience.
But, how do you go about doing that? Don’t worry, we have a simple step-by-step data analysis guide for you.
Step 1: Define the Problem (The Problem Statement)
Every analysis starts with a clear hypothesis or question. You need to identify what you’re trying to answer and which key performance indicators (KPIs) or business metrics matter. It’s critical that the scope is correct: misaligned objectives or poorly defined parameters can lead you to draw conclusions from the wrong data.
To do this effectively, analysts must combine domain experience with business intelligence skills, knowing not only how to crunch numbers but also understanding the business goals behind the numbers.
Step 2: Data visualization and DMPs
Once the problem is set, it’s time to decide on tools. Beyond soft skills like lateral thinking, analysts turn to data visualization, data management platforms (DMPs), and reporting tools. These help structure, aggregate, and visualize data so that it becomes easier to interpret and share.
Popular DMP platforms include Salesforce, SAS, and open-source options like Pimcore. On the visualization side, Google Charts, Datawrapper, Grafana, and DataBox help bring analytic findings to life with dashboards, graphs, and dynamic filtering.
Having the right tools in place can mean the difference between insights that are actionable and insights that get lost in translation.
Step 3: Collect the Data
Your next move is to build a strategy for data collection. This may involve:
- Quantitative data: Sales figures, customer flow, monthly revenue, website analytics.
- Qualitative data: Customer surveys, user feedback, reviews, interviews.
You’ll also need to classify your data sources:
- First-party data: Collected directly, like CRM or transaction logs.
- Second-party data: Shared or partnered data from another organization.
- Third-party data: Purchased or aggregated from external sources, industry-wide providers.
Step 4: Data Cleaning
Here’s where it gets real: data cleaning is essential. Data analysts often spend 60% to 80% of their time cleaning and preparing data. Cleaning involves de‑duplicating, removing invalid entries, standardizing formats, and more; all prerequisites to trustworthy analysis.
This process, while time-consuming, is crucial to avoid misleading insights. Bad data can lead to bad decisions, so don’t skip this step.
Fortunately, there are several data analytic tools known for automating or streamlining data preparation, cleaning, and wrangling. Some of our favorites include:
- Alteryx Designer: Great for visual workflows and automation
- OpenRefine: Open source, and ideal for de-duplicating and cleaning text-heavy datasets
- Pandas & Python: Powerful and scriptable for Python users
These tools don’t just save time—they reduce human error and increase reproducibility.
[Also check out: Python vs. Rust: Which one should you choose?]
Step 5: Analysis and Modeling
Once the dataset is clean, the interesting part begins. You choose the type of analysis fitting your goals:
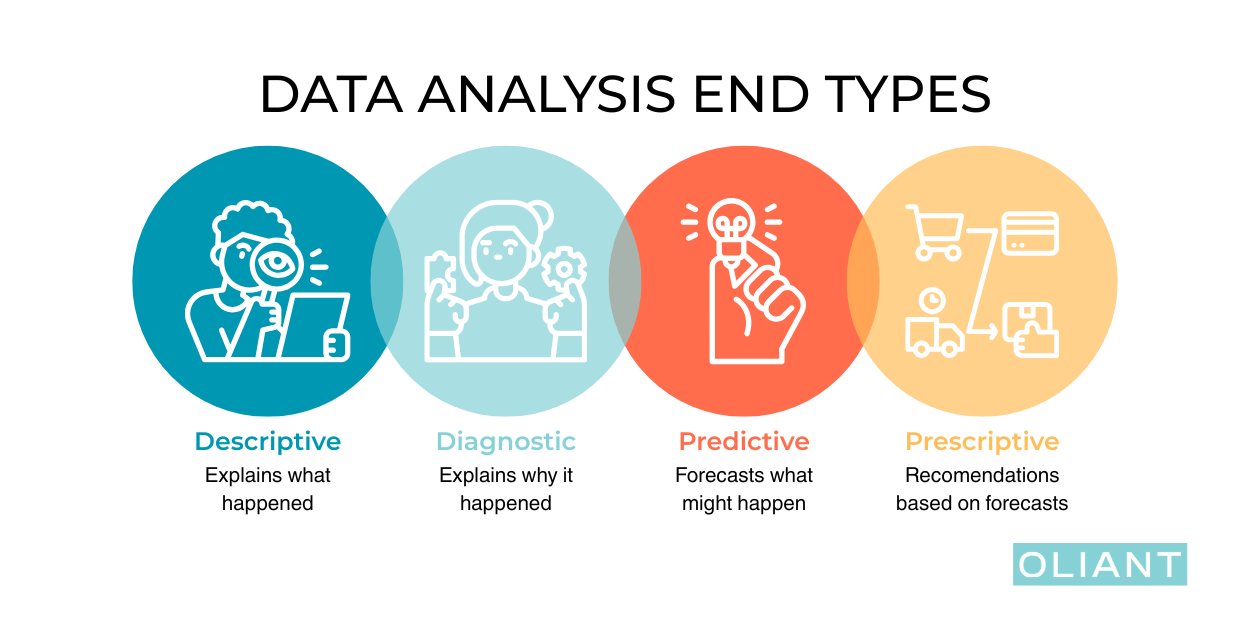
- Descriptive analytics: What happened? Summaries, distributions, trends.
- Diagnostic analytics: Why did it happen? Root‑cause analysis.
- Predictive analytics: What might happen next? Regression, forecasting.
- Prescriptive analytics: What should we do? Decision frameworks.
Techniques like time-series analysis, regression, and univariate/bivariate analysis help translate raw data into practical business insights. This is where patterns emerge, problems are revealed, and opportunities become visible.
Step 6: Data Visualization & Presentation
Finally, you present findings in a way decision-makers can absorb. A survey by The Australian found that 90% of professionals use data weekly, yet many avoid it due to anxiety or lack of skill. The same survey concluded that effective data storytelling can improve business performance by up to 20%, making insight clear and actionable.
Visual tools like Datawrapper or Google Charts are great for transforming tables and numbers into engaging visuals that guide actions, turning well‑presented data analysis into strategy.
What does the Data Analytics look like in 2025?
The data analytics market for 2025 is booming. In 2024, global market value ranged from roughly $69–$74 billion, and it’s only expected to keep growing.
IMARC Group forecasts growth from around $74 billion in 2024 to $482 billion by 2033, at a CAGR of ~23%, while Grand View Research puts 2024 at $69.5 billion and forecasts $302 billion by 2030 (CAGR ~28.7%).
Other speculations and projections estimate growth from $75 billion to nearly $95 billion by 2025.
Such demand reflects increasing reliance on analytics for a competitive edge. However, a global survey in 2025 found only 24% of companies feel their analytics capabilities are mature, which could reflect a gap in truly professional, specialized data science talent.
This could be related to how most organizations today integrate AI and automation to streamline tasks, showing perhaps an overdependence on AI analysis tools where humans should be involved. After all understanding the customer journey is arguably the most important part of data analytics.
Wrapping It Up: The Whole Image
So much of great analytics depends on that first choice to undertake the project. But it's equally about the structure: defining the question, gathering the right first‑, second‑ and third‑party data, cleaning it rigorously, applying the right analytical tools, and presenting clear, visual findings.
Getting a handle on data cleaning, data analysis tools, data visualization, and robust business intelligence will allow you to build a well-run analytics framework and give your organization the first step towards growth.


.png)


.png)


.png)


.avif)


.avif)
